|
Introduction
What You'll Learn
In lesson you'll learn about the main changes that happen in the bodies of seniors as they get older.
Why is This Important?
Understanding how and why the body changes helps us to make better motivational, nutritional and training recommendations.
In lesson you'll learn about the main changes that happen in the bodies of seniors as they get older.
Why is This Important?
Understanding how and why the body changes helps us to make better motivational, nutritional and training recommendations.
A range of physiological changes happen to our bodies as we age. As I want to keep this course as practical and applicable to you as possible, I will highlight and explain some of the most relevant that we, as professionals, can influenced. Those that we can’t influenced, I will just mention briefly
Sarcopenia
The term sarcopenia was first introduced by researcher Irwin Rosenberg in a 1989 paper published by the American Society for Nutrition, as an age-related muscle loss. It comes from Greek words sarx and penia, and literally translates as “flesh loss”. Since 1989, there has been a boom in research on sarcopenia, which led to the introduction of the term dynapenia 20 years later, which we will explore shortly.
How much muscle do we lose through sarcopenia and what are the consequences?
According to different sources we lose about 0.5% of muscle mass per year from the age of 30, but this varies depending on the individual’s lifestyle choices and genetics. We lose more lean muscle mass from our lower body than upper body, and women generally suffer more from sarcopenia. This is probably due to females having lower muscle mass overall, and also the fact that they live longer than males on average. When considering females, menopause has little or nothing to do with age-related muscle loss.
According to various surveys and studies, sarcopenia affects 8% to 30% of the population in the US alone, and costs $18 billion dollars a year, with some reports stating that it may exceed $20 billion. This is about 25% more than is spent on fractures happening due to low bone density.
Current data presents conflicting perspectives on the real-life impairments caused as a result of sarcopenia, but the risk of falling and hospitalisation is definitely a big one, as an individual may drop below the critical level of muscle mass that is needed for independent living. E.g. having enough muscle and strength to move one leg in front of the other for walking.
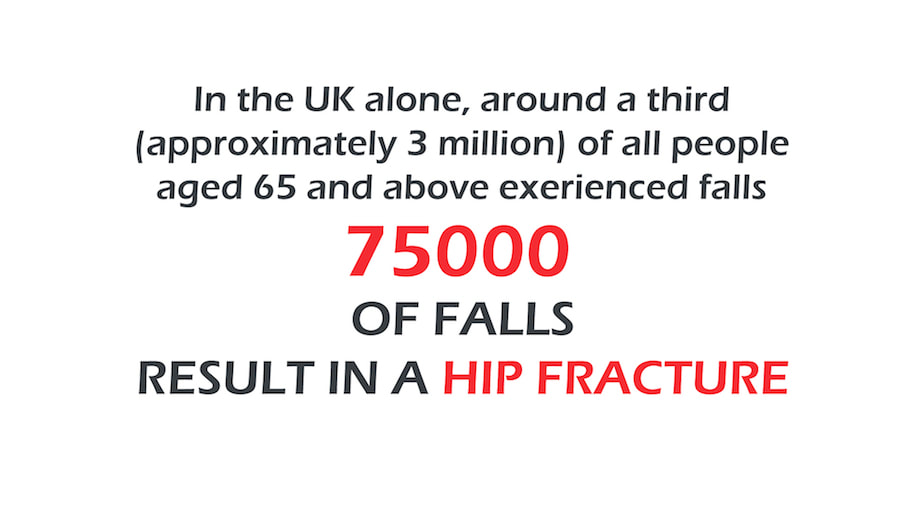
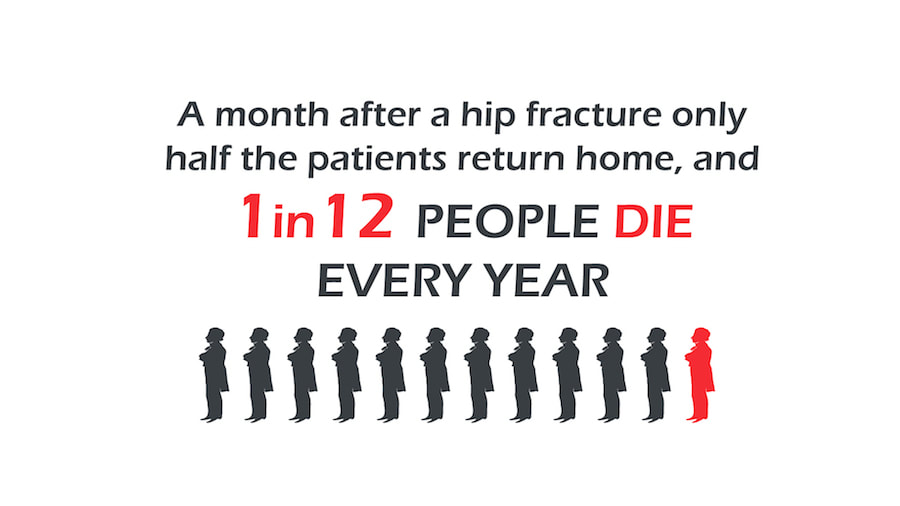
Now, for some sobering statistics. In the UK alone, around a third (approximately 3 million) of all people aged 65 and above experience falls, and 75,000 of falls result in hip fracture. This not only drives up medical costs of treating these fractures to £2 billion, but sadly, a month after a hip fracture only half the patients return home, and 1 in 12 people die every year.
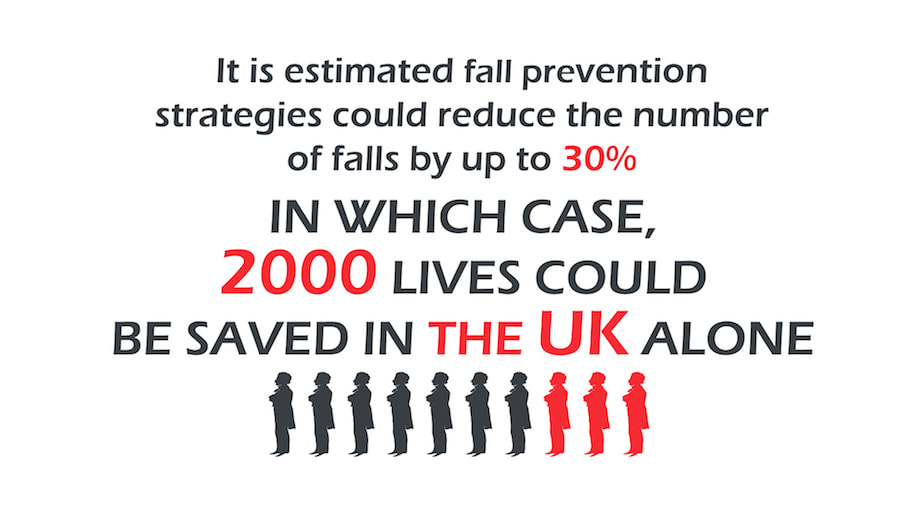
That is over 6,000 deaths caused by fall and hip fractures in the UK. It is estimated that fall prevention strategies could reduce the number of falls by up to 30%; in which case, 2,000 lives could be saved in the UK alone.
Before we discuss how to check if an individual is sarcopenic and how to help lower the risks, slow down the muscle loss and therefore reduce associated costs for treatment, I will walk you through the possible factors that cause age-related muscle loss.
Preventing muscle loss is impossible. The only anti-ageing solutions are hibernation or time-travel; both in preliminary testing at the moment.
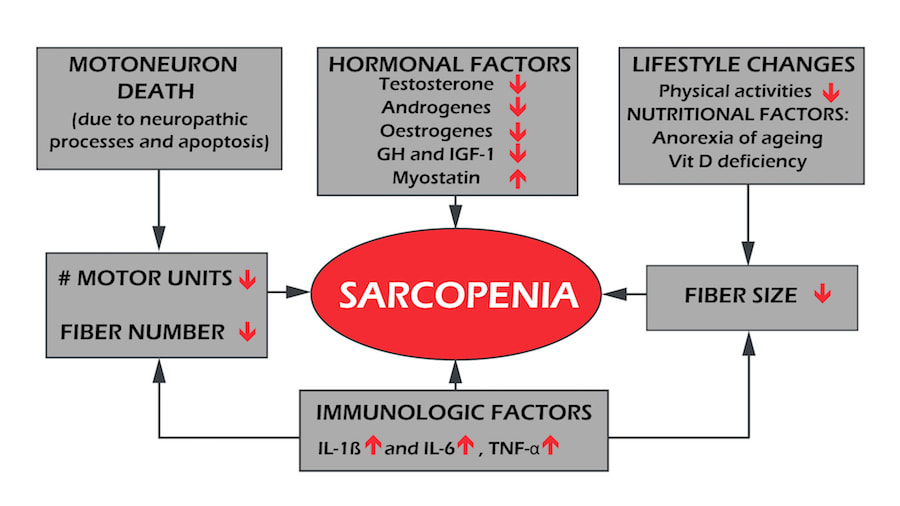
Sarcopenia, while still not fully understood, can be characterised by the loss of motor neurons and muscle fibres per motor unit. This change within the motor unit causes remodelling of the muscle architecture (change in fibre length and the angle of insertion into the tendon) and blunts the response of the muscle.
Initially, we lose more type II muscle fibres, then by the age of 80, we start to lose more type I muscle fibres until the ‘new balance’ of type I/II is reached.
Interestingly, the actual number of motor units doesn’t change until the age of 60, at which point it rapidly declines by about 3% a year, leaving us with roughly a 60% loss of motor units with already remodelled motor neurons and muscle fibres by the age of 80.
On an endocrinological level, we have:
Other factors are:
These factors all play a role in the development of sarcopenia. [19, 20, 28, 30]
Preventing muscle loss is impossible. The only anti-ageing solutions are hibernation or time-travel; both in preliminary testing at the moment.
Sarcopenia, while still not fully understood, can be characterised by the loss of motor neurons and muscle fibres per motor unit. This change within the motor unit causes remodelling of the muscle architecture (change in fibre length and the angle of insertion into the tendon) and blunts the response of the muscle.
Initially, we lose more type II muscle fibres, then by the age of 80, we start to lose more type I muscle fibres until the ‘new balance’ of type I/II is reached.
Interestingly, the actual number of motor units doesn’t change until the age of 60, at which point it rapidly declines by about 3% a year, leaving us with roughly a 60% loss of motor units with already remodelled motor neurons and muscle fibres by the age of 80.
On an endocrinological level, we have:
- reduced insulin-like growth factor 1 (IGF-1) signalling
- increase in insulin resistance
- affected thyroid function
Other factors are:
- blunted anabolic response of Muscle Protein Synthesis (MPS) upon feeding
- sex hormones
- cell death (apoptosis)
- malnutrition
- inactivity
These factors all play a role in the development of sarcopenia. [19, 20, 28, 30]
Different organisations have different definitions for sarcopenia.
The EWGSOP (European Working Group on Sarcopenia in Older People) suggests starting with a gait test and going from there and has proposed the following algorithm.
Other similar definitions are provided by IWGS (International Working Group on Sarcopenia) and FNIH (Foundation of the National Institute of Health). [27]
The EWGSOP (European Working Group on Sarcopenia in Older People) suggests starting with a gait test and going from there and has proposed the following algorithm.
- A gait test can be conducted on a 4m track, so a successful test should last less than 5 seconds.
- Alternatively, due to lack of space or cones, you can use a treadmill to measure the speed. A successful test is done on speeds above 2.9 kph or 1.8 mph. Bear in mind that clients are not good at pacing themselves on the treadmill, hence they usually end up with a worse score.
- Grip strength is measured by dynamometer (NOTE: the best are hydraulic dynamometers and not pneumatic ones). Normal grip is above 26 kg for men and 16 kg for women.
- Muscle mass is most accurately measured when tested in DXA machines, rather than BIA (Bioelectrical impedance analysis), as the latter systematically overestimates muscle mass.
- Alternatively, if other equipment isn’t available, anthropometric measurements can give you a rough estimate of muscle mass, for example, using the Navy Body Fat Test. However, as stated in official guidelines, anthropometric measures are vulnerable to error and not recommended for routine use in the diagnosis of sarcopenia.
- Muscle mass tested was summed as the muscle mass of the four limbs from a DXA scan as appendicular skeletal muscle mass (ASM) and defined a skeletal muscle mass index (SMI) as ASM/height2 (kg/m2). A SMI two standard deviations below the mean SMI of young male and female reference groups, was defined as the gender-specific cut-off point for sarcopenia.
- Cut-off points for men varied from 7.23 kg/m2 to 7.26 kg/m2 and for women, from 5.5 kg/m2 to 5.67/m2
- If using BIA machines, muscle mass cut-off points are moved. Moderate sarcopenia in men starts at 10.75 kg/m2 and for women, at 6.75 kg/m2.
- Despite this being a very thorough classification, it has not produced significant associations with health outcomes and misclassifies obese older adults. [18, 27, 31, 32]
Other similar definitions are provided by IWGS (International Working Group on Sarcopenia) and FNIH (Foundation of the National Institute of Health). [27]
Dynapenia
This term was coined from an observation that muscle strength can be lost despite building muscle mass; and that muscle strength, not mass, is highly predictive “of functional status and mortality. The most popular tests to measure dynapenia are grip strength and the knee extensor test. [20, 31, 32, 33, 34, 35, 36]
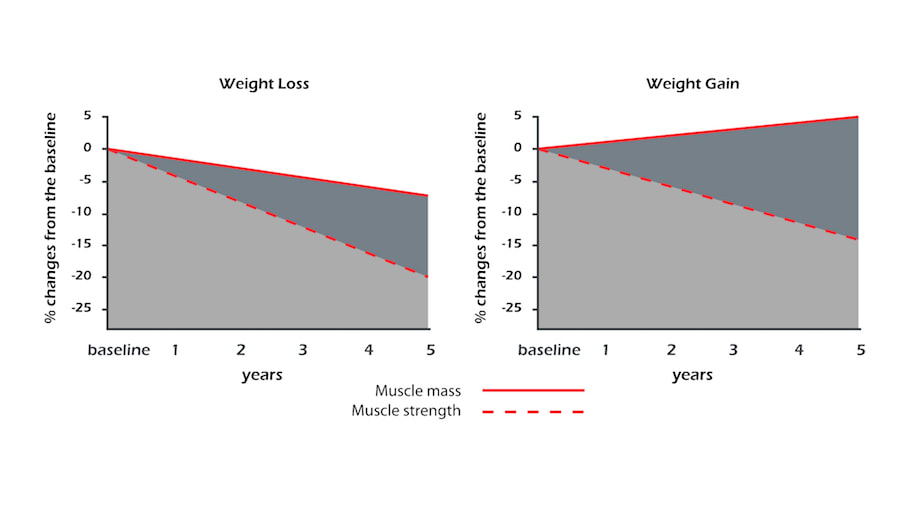
Muscle strength is lost 2-5 times faster than muscle mass and at the moment, it is established that up to 18% of women and 10% of men in the US older than 65 cannot lift 10 lbs (4.4 kg) or kneel down.
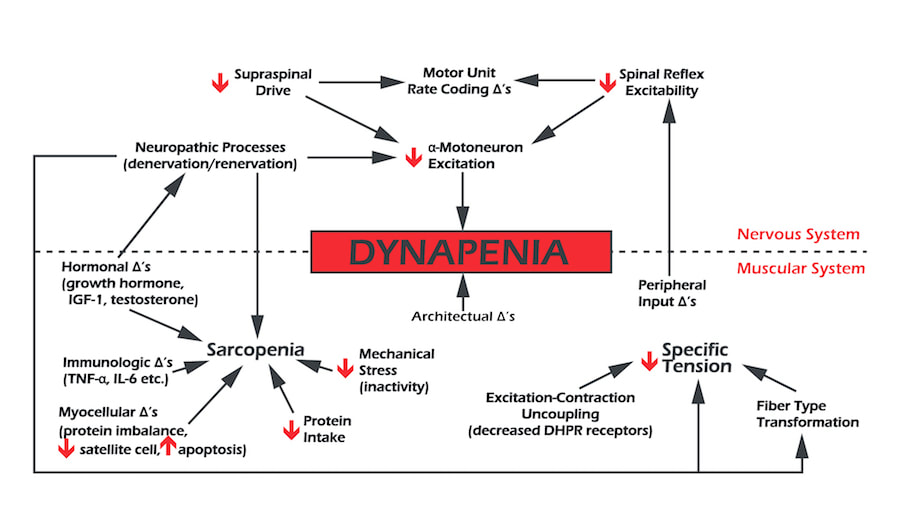
Causes of dynapenia are multifactorial. On an architectural level, as described with sarcopenia, we have the change in muscle fibre size and number; and because muscle fascicles (a group of muscle fibres) shortening predicts muscle shortening speed, the force of contraction will be lowered, but eccentric lengthening should not be affected as much.
On a neurological level, it is possible that the ability to fully activate skeletal muscle voluntarily is impaired in dynapenic individuals because of factors such as:
- decreased excitatory drive to the lower motor neurons
- and/or
- decreases in α-motor neuron excitability.
I will now highlight two fantastic studies on the benefits of strength.
In 2008, a study with almost 9,000 participants showed that people over the age of 60 and classified in the lowest third of strength within this demographic, were 50% more likely to die of all-cause mortality than individuals in the upper third for strength. The weakest individuals were 50% more likely to die than the strongest individuals.
In 2008, a study with almost 9,000 participants showed that people over the age of 60 and classified in the lowest third of strength within this demographic, were 50% more likely to die of all-cause mortality than individuals in the upper third for strength. The weakest individuals were 50% more likely to die than the strongest individuals.
Another study showed that 80-year-old trained individuals had similar muscle power to 60-year-old untrained individuals, suggesting that we can slow down muscle and power decline by 20 years.
Screening for dynapenia is out of our scope of practice, but there are things to look out for which can help you decide whether to refer the individual for an official diagnosis.
In 2012, the Journal of Gerontology published a paper that proposes the following algorithm:
In 2012, the Journal of Gerontology published a paper that proposes the following algorithm:
- client older than 60 years of age
- low physical activity (less than 150 minutes of moderate aerobic activity per week)“-self-reported muscle weakness
- unintentional weight loss (sudden weight loss is categorised as losing over 10 lbs in three months)
- diagnosed osteoarthritis
- self-reported fatigue or exhaustion,
- obesity, BMI over 30 kg/m2
You can also use grip strength:
- Grip strength is measured by dynamometer (NOTE: best are hydraulic dynamometers and not pneumatic ones)
- Normal grip is above 26 kg for men and 16 kg for women. [33, 38]
Motor Control and Skill
Motor skill can be categorised into fine motor skills, usually manipulating an object whilst sitting down; and gross motor skills, once we will see that in the gym. Both require a great deal of muscular involvement; total body and/or multi-limb movements.
As the complexity of movements increases, a difference between younger and older people has been shown. It is possible for people to learn and master new movements until a very old age, but it may take more time and more repetition, so as a practitioner or trainer, clear visual instructions and patience are vital.
As the complexity of movements increases, a difference between younger and older people has been shown. It is possible for people to learn and master new movements until a very old age, but it may take more time and more repetition, so as a practitioner or trainer, clear visual instructions and patience are vital.
Bone Density
As we age we lose bone density, often on a par with losing muscle mass.
Two pathological states that come from losing bone mass are osteopenia and osteoporosis.
Areal bone mineral density (aBMD) is measured using DXA scans, primarily at the hip and the lumbar region.
Osteopenia was defined as an aBMD level between 1 and 2.5 SD below the young normal mean.
Osteoporosis was defined by the World Health Organisation (WHO) in 1994 as a bone mineral density of less than 2.5 standard deviations below the sex-specific young adult mean, and this characterisation has been adopted globally.
Subsequently, a further step forward was taken when bone mineral density was incorporated into fracture risk prediction algorithms, such as the Fracture Risk Assessment Tool (FRAX®), also developed by the World Health Organization. This, unfortunately, goes beyond our scope of practice and the material of this course.
Exercise can help decelerate loss of bone density and fall risk, due to:
- improved cognition
- promoting the creation of bone through direct mechanical stimulus coming from the muscle via movement under a load
- hormones such as the growth hormone having a positive effect on both muscle and bones.
However, please consider exercises in terms of benefit to risk ratio. Any risk of falling whilst performing an exercise outweighs all of the benefits that someone is getting from the activity.
Stability
Receptors that monitor and help to maintain stable blood pressure, called baroceptors, become less sensitive with age. This helps explain why older people get dizzy more often when changing position from sitting/ lying down to standing. We will discuss falls and fall prevention in more detail later in the course.
Aerobic Capacity
Studies point towards a 5% - 20% decrease of aerobic capacity per decade. It is not, however, a linear decrease. It ranges from 3% to 6% in your 30s and 40s, to over 20% per decade after the age of 70.
This is hugely accelerated by bed rest, where some patients lost 12% of aerobic capacity in a space of just 10 days.
That information alone should put you off hard HIIT style sessions with any senior beginners!
The more advanced the age, the faster the loss of aerobic function. This can be reduced by regular activity.
It’s also important to remember that this data and a lot of data available may be skewed, as people who apply for such studies are generally healthier than the rest of the population.
Unlike muscle strength and power, there is no clear data on the connection between aerobic capacity and disability. This may be due to the fact that tasks of daily living rarely require anything that is close to someone’s aerobic capacity as opposed to strength and power levels.
In practice, however, all of the fitness traits do go together and improve quality of life - something we will talk about in more detail later.
Aches and Pains
What is pain? According to International Association for the Study of Pain (IASP), pain is an “unpleasant sensory or emotional experience associated with actual or potential tissue damage or described in terms of such damage”. This was later updated to state that "pain is a distressing experience associated with actual or potential tissue damage with sensory, emotional, cognitive, and social components."
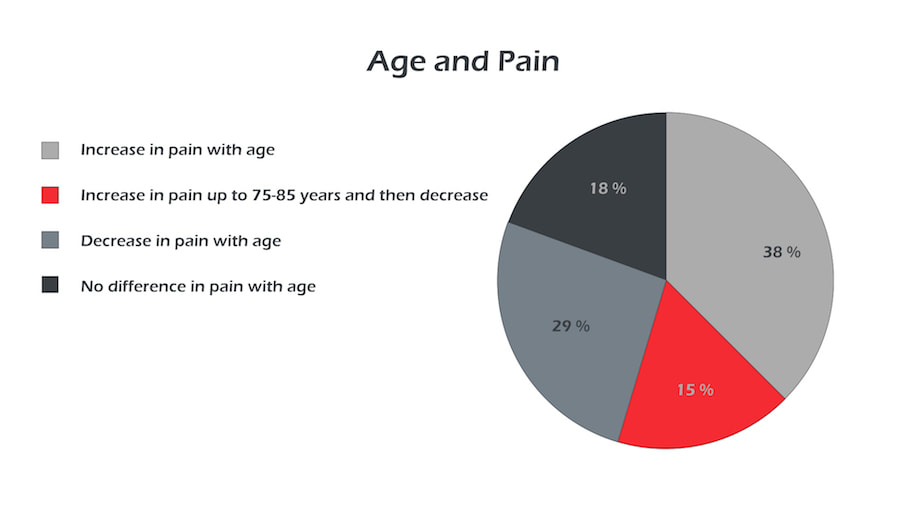
There is a prevalent stereotype that pain increases with age. I'm sure most of us have heard our clients/patients saying, “It’s just old age”, or “I’m old, that’s why <pointing at body part> it hurts.” However, when looking at the data, the answer is inconclusive at best. Roughly 50% of studies show an increase in pain with age, but another 50% show a decrease of pain with age.
There is a prevalent stereotype that pain increases with age. I'm sure most of us have heard our clients/patients saying, “It’s just old age”, or “I’m old, that’s why <pointing at body part> it hurts.” However, when looking at the data, the answer is inconclusive at best. Roughly 50% of studies show an increase in pain with age, but another 50% show a decrease of pain with age.
There is also an important limitation to pain studies for older people; this being that getting older increases chances of suffering from other illnesses or disabilities, and depression. That, coupled with the aforementioned expectations of feeling pain, can hugely influence someone's experience of pain. Another problem is that pain is a highly subjective occurrence. Pain does not automatically mean that someone is injured, and measuring it is very difficult.
I will now share some evidence-based practice to help deal with pain in seniors. At the end of the course, in ‘Recommended Reading’, I will also post links for you to explore pain or other subjects discussed in this course further.
If you are a therapist, you will know about the Flag Systems, but as a personal trainer you are likely lacking in education on the topic, as it does not feature in the standard qualification curriculum.
The flag system was developed to set markers of risk factors in musculoskeletal disorders. These markers help you to identify the risk for the patient and also help you to shape your scope of practice.
Examples are taken directly from the website: http://www.physio-pedia.com/The_Flag_System
If you suspect a medical red flag, you must seek urgent medical attention on behalf of the individual and send them to A&E.
As we can see from the table, when looking at a yellow flag and considering the information we have about psychosocial aspects of pain, we know that attitudes and beliefs alter the experience of pain. People who are stoic and people who have high locus of control (belief that they can influence things) have lower reported pain and distress, comparing to others. This works in reverse for someone who is having depressive thoughts; they will report higher pain and distress.
Similarly, an individual’s environment and what their spouse, colleagues (colleagues and work environment falls under blue flag, however) and friends are telling them can impact their perception of pain. Using catastrophic language can increase the feeling of pain, and contribute to fear of movement (kinesiophobia) and fear of avoidance.
As a trainer, people will come to you with predisposed beliefs about their conditions and pain levels, and a simple Par-Q will not cut it. When you are dealing with a client who is in pain you should use positive language ask open-ended questions about how he or she perceives the situation and don’t interrupt them when they are relaying pain information
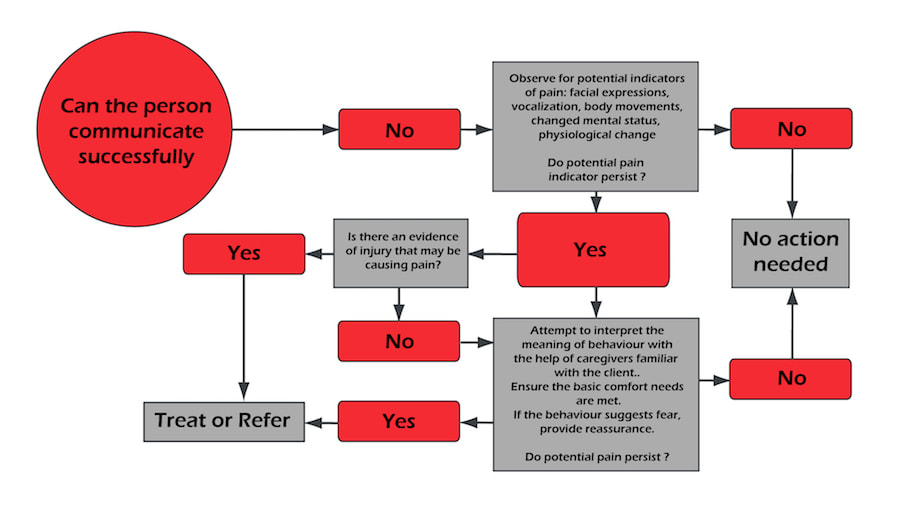
Pain assessment is provided.
Pain assessment chart if you can communicate with a client
Pain assessment chart if you can’t communicate with a client
Pain Thermometer and Pain Map
More Lessons From This Module
Access the whole Strong Ageing course and get certified with a $50 discount. Use coupon code IPT50 at checkout:

